Correlation
Out of the 3 dimensionality reducing algorithms we have, this is by far the easiest one to understand. It seeks to do the same as the other 2, reduce the complexity of our dataset.
How does it work?
The procedure this algorithm follows is simple. It looks at the data from our patients and tries to find pairs or tuples that are correlated. That means, that follow more or less the same patterns. This is because many variables often vary along the same lines as other parameters, and if we find one that goes up everytime another one goes up, we can get rid of one of them, taking into account only the other one.
For instance, let's suppose that we're doing a blood analysis on several patients and we find that some of them have a high creatinine level in their blood. This would automatically lead you to think that they have a problem with their glomerular filtration, because almost always one goes tied to the other. Well, this algorithm works the same way: finds variables that are usually tied to one another and instead of taking into account both of them it ignores one and uses the first one it found, because it knows that the one that it's ignoring has a value that's easy to deduce from the one that it's using.
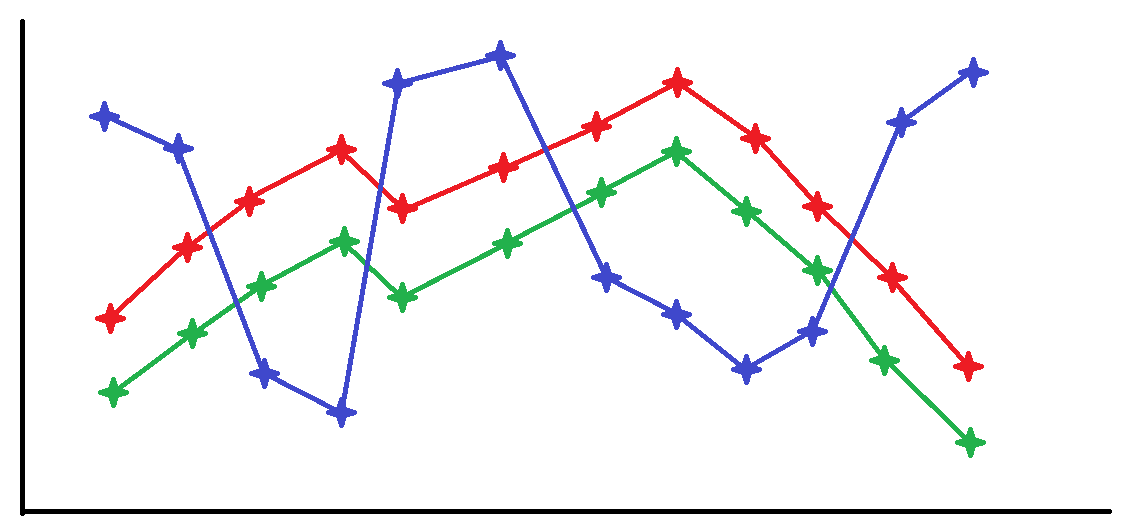
Here, the red and green variables are correlated. When one goes up or down, the other does so as well, so we can just ignore the green one, knowing it will always be around X lower than the red one.
Two variables can also be correlated in many other ways: One can always be the double as the other, or the inverse of the other, so the algorithm finds all these relations to work with as little parameters as possible, knowing that the ones it has discarded are related to the ones it uses, and knowing how they are related.